In today’s data-driven world, Data Visualization and Reporting are crucial for turning raw data into actionable insights.
Our Approach Includes:
Data Integration & Aggregation
onsolidating data from multiple sources (CRM, ERP, finance systems, etc.) into a single, cohesive reporting framework for a unified view of your business.
Advanced Data Analytics
Leveraging predictive analytics and data modeling to uncover trends, forecast outcomes, and support strategic decision-making.
Visual Storytelling
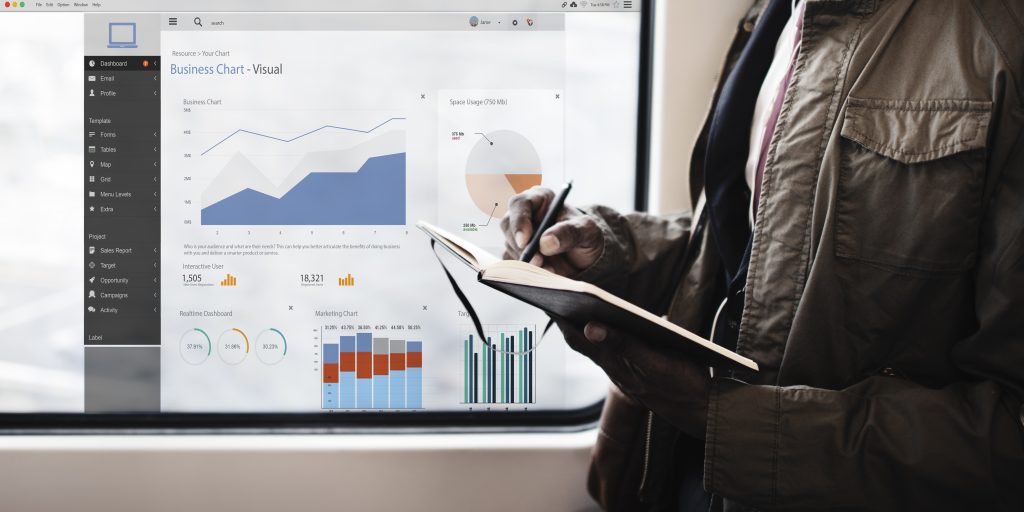
Transforming complex datasets into easy-to-understand visual formats (graphs, charts, heatmaps, etc.), making insights accessible to all levels of the organization.
Automated Reporting
Implementing automated reporting systems that deliver accurate, timely reports directly to your team, reducing manual effort and increasing efficiency.
Compliance & Regulatory Reporting
Creating detailed, compliant reports that meet industry-specific standards and regulatory requirements, ensuring transparency and accountability.
Training & Support
Empowering your team with the tools and knowledge to effectively use and interpret data visualizations and reports for ongoing success.